Key Takeaways
- Global insured catastrophe losses reached USD 107 billion in 2025, with secondary perils (wildfire, severe convective storm, flood) accounting for a record 92% of that total - a structural shift toward more frequent, smaller, harder-to-process events rather than a handful of mega-catastrophes (Swiss Re Institute, 2026).
- Losses below USD 2 billion have run roughly 30% above their 10-year average, pushing more attritional risk back onto cedants and multiplying the volume of treaty, bordereaux and claims data that has to move between cedant and reinsurer (Guy Carpenter, 2025).
- Reinsurer capital is not scarce - global dedicated reinsurance capital was on track to reach approximately USD 650 billion by year-end 2025, the highest since 2018 - but the operational pipes connecting that capital to risk still run largely on email and spreadsheets (Guy Carpenter, 2025).
- Capgemini's 2026 insurance outlook argues the industry's real divide is not who has AI tools, but who has redesigned the underlying workflow: "You can't bolt AI onto legacy processes and expect enterprise-wide transformation" (Capgemini, via Reinsurance News, 2026).
- For Gulf and APAC underwriting and finance leaders, the practical question is no longer whether reinsurance is available - it increasingly is - but whether their own data infrastructure can move fast and cleanly enough to use it.
Introduction: A Capital Problem That Has Become a Plumbing Problem
For most of the last three years, the reinsurance conversation in APAC and the Gulf has been about price and capacity: hard markets, rate increases, tighter terms. That cycle has turned. Guy Carpenter's late-2025 renewal commentary describes APAC moving from a sellers' market to a buyers' market, with widening capacity, rate cuts, and global reinsurer dedicated capital approaching its highest level since 2018 (Guy Carpenter, 2025). On paper, 2026 should be the easiest year in some time to place a treaty.
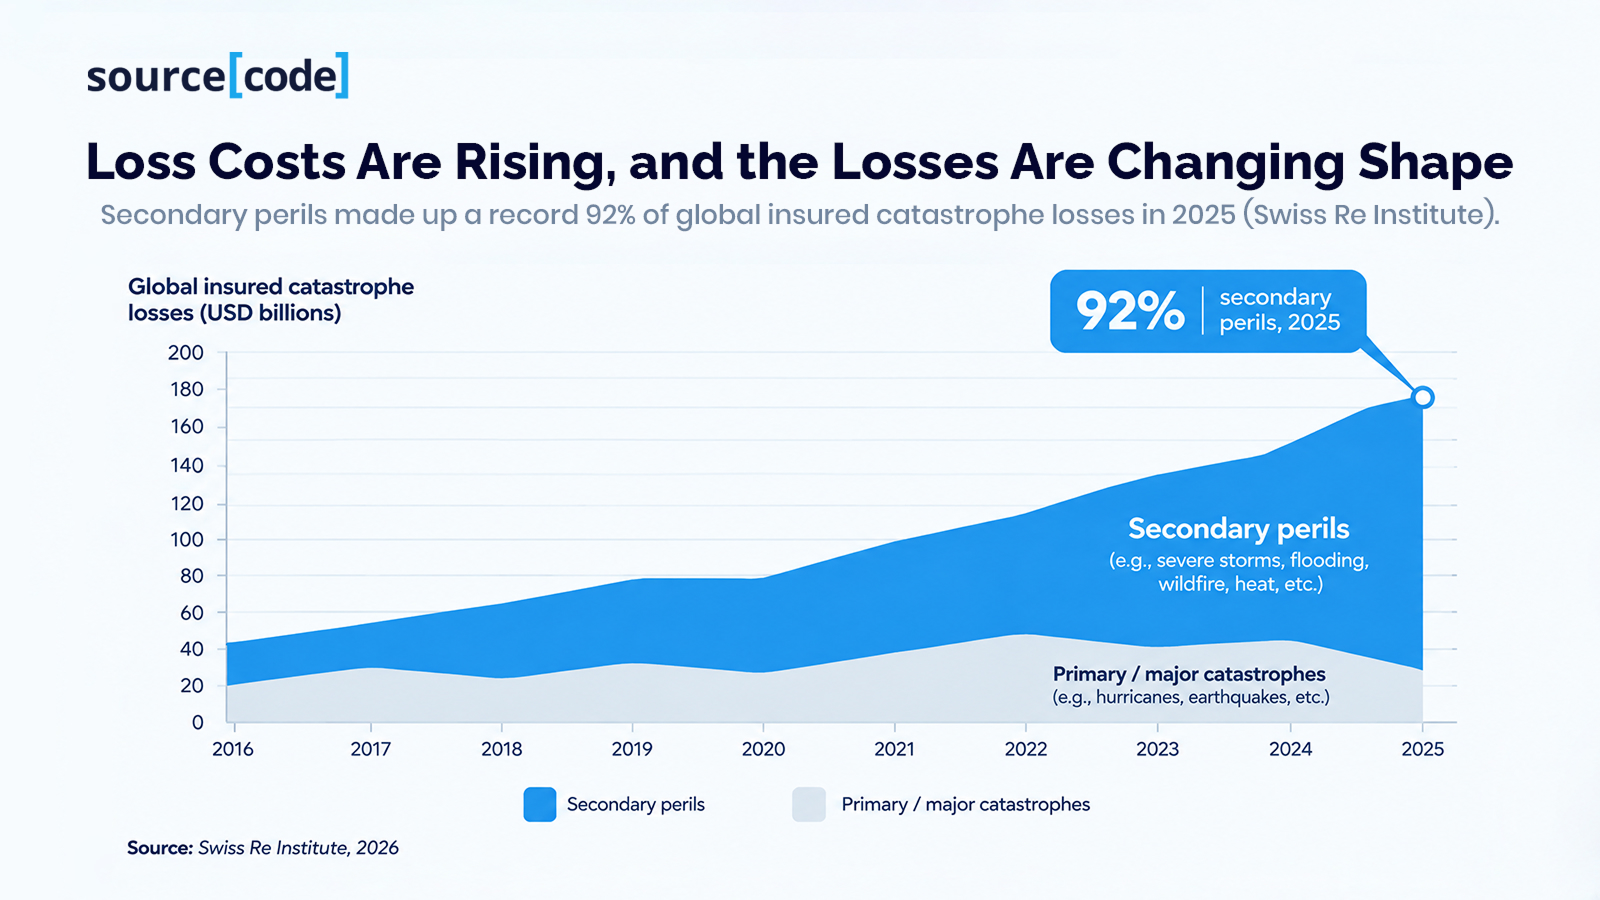
It is also, paradoxically, the year the industry's data problem becomes harder to ignore. Swiss Re Institute's 2025 sigma results show secondary perils - wildfire, severe convective storm, flood - now account for a record 92% of global insured catastrophe losses, with long-term insured natural catastrophe losses growing at 5-7% a year (Swiss Re Institute, 2026). Guy Carpenter separately notes that losses below USD 2 billion are running about 30% above their 10-year average, meaning cedants are retaining and reporting far more frequent, smaller events than the historical treaty structure was built to process cheaply (Guy Carpenter, 2025).
Put those two facts together and the shape of the problem changes. Capacity is not the constraint. Throughput is. Every one of those smaller, more frequent events still has to travel through the same submission, bordereaux and claims reporting chain that was designed for a world of fewer, larger catastrophes - a chain that, across much of the market, still runs on PDF submissions, bespoke Excel bordereaux templates and email threads. When event frequency rises faster than the operational capacity to process the data behind each event, the bottleneck stops being how much capital reinsurers are willing to deploy and starts being how fast and how cleanly cedant and reinsurer systems can exchange information about what they are actually covering, and what they have actually lost.
That is the thesis of this piece: as loss frequency rises and reinsurance structures grow more varied - quota share, excess of loss, parametric, structured capital, catastrophe bonds - the manual cedant-to-reinsurer data handoff is shifting from a back-office inefficiency to a genuine constraint on how much of the available capacity an insurer can actually use, and how fast.
Market Context: Why Loss Costs and Reinsurance Reliance Are Both Climbing
Three verified trends are converging on underwriting and finance teams at once.
Loss frequency and severity are both rising, driven by perils that generate more data events, not fewer. Swiss Re Institute puts 2025 global insured catastrophe losses at USD 107 billion against total economic losses of USD 220 billion - meaning roughly 49% of losses were insured, the highest insured share on sigma's record (Swiss Re Institute, 2026). The Los Angeles wildfires alone generated an estimated USD 40 billion in insured losses, the largest wildfire loss on Swiss Re's record books, while severe convective storms caused USD 51 billion, the third-costliest year on record for that peril (Swiss Re Institute, 2026). Unlike a single major hurricane landfall - of which there was none in the US in 2025 - wildfire and convective storm losses arrive as large numbers of discrete claims, each requiring its own line of bordereaux or claims data rather than a single large notification.
Reinsurance capacity is ample, but increasingly structured, not simple. Guy Carpenter's analysis of the APAC market describes insurers using catastrophe bonds, structured solutions and sidecars alongside traditional treaty to access capacity, with earnings-protection covers expected to be introduced into the region in 2026 (Guy Carpenter, 2025). Each of these instruments has its own data requirements and reporting cadence. A market that is diversifying its capital sources is, by definition, a market that needs more frequent, more varied, and more precisely formatted data exchange - not less.
The industry itself recognises this is an execution gap, not a capital gap. Capgemini's January 2026 outlook, reported by Reinsurance News, found that 70% of insurers are planning AI agent deployments at scale and 88% have adopted hybrid cloud to modernise legacy IT - yet Capgemini's Luca Russignan argues the resulting divide between leaders and laggards in 2026 will come down to whether firms redesigned their underlying processes, not whether they bought the technology: "That's not a technology gap - it is a business model gap" (Capgemini, via Reinsurance News, 2026).
For a Gulf or APAC cedant, the practical translation is this: the capital is there, the instruments to access it are multiplying, and the constraint has moved to whether the submission, bordereaux and claims data behind each of those instruments can move cleanly and on time.
The Treaty Data Handoff Map
Definition. The Treaty Data Handoff Map is a decision framework that traces every point at which treaty, facultative, bordereaux or claims data physically changes hands between a cedant and a reinsurer (or intermediary) - identifying where the data is reformatted, re-keyed, validated, or simply emailed as an attachment rather than exchanged through a governed, structured process. It is used to locate exactly where submission quality degrades, where bordereaux reconciliation breaks down, and where claims notification lags, rather than treating "data problems" as one undifferentiated issue.
Industry commentary on bordereaux processing confirms why this mapping exercise matters. A widely cited analysis from Charles Taylor describes three persistent, structural problems in how bordereaux move between coverholders, brokers and (re)insurers: the absence of a standard format, because every bordereau arrives with its own formatting, presentation and reporting approach; heavy reliance on manual, "conveyor-belt" mapping work performed by skilled technicians who must individually know the applicable regulation, required fields, validations and formulae for each source; and ongoing data quality and consistency issues, where early bordereaux may not clearly show how endorsements, cancellations or return premiums were reported, with historic data later appearing in inconsistent formats (Charles Taylor, n.d.).
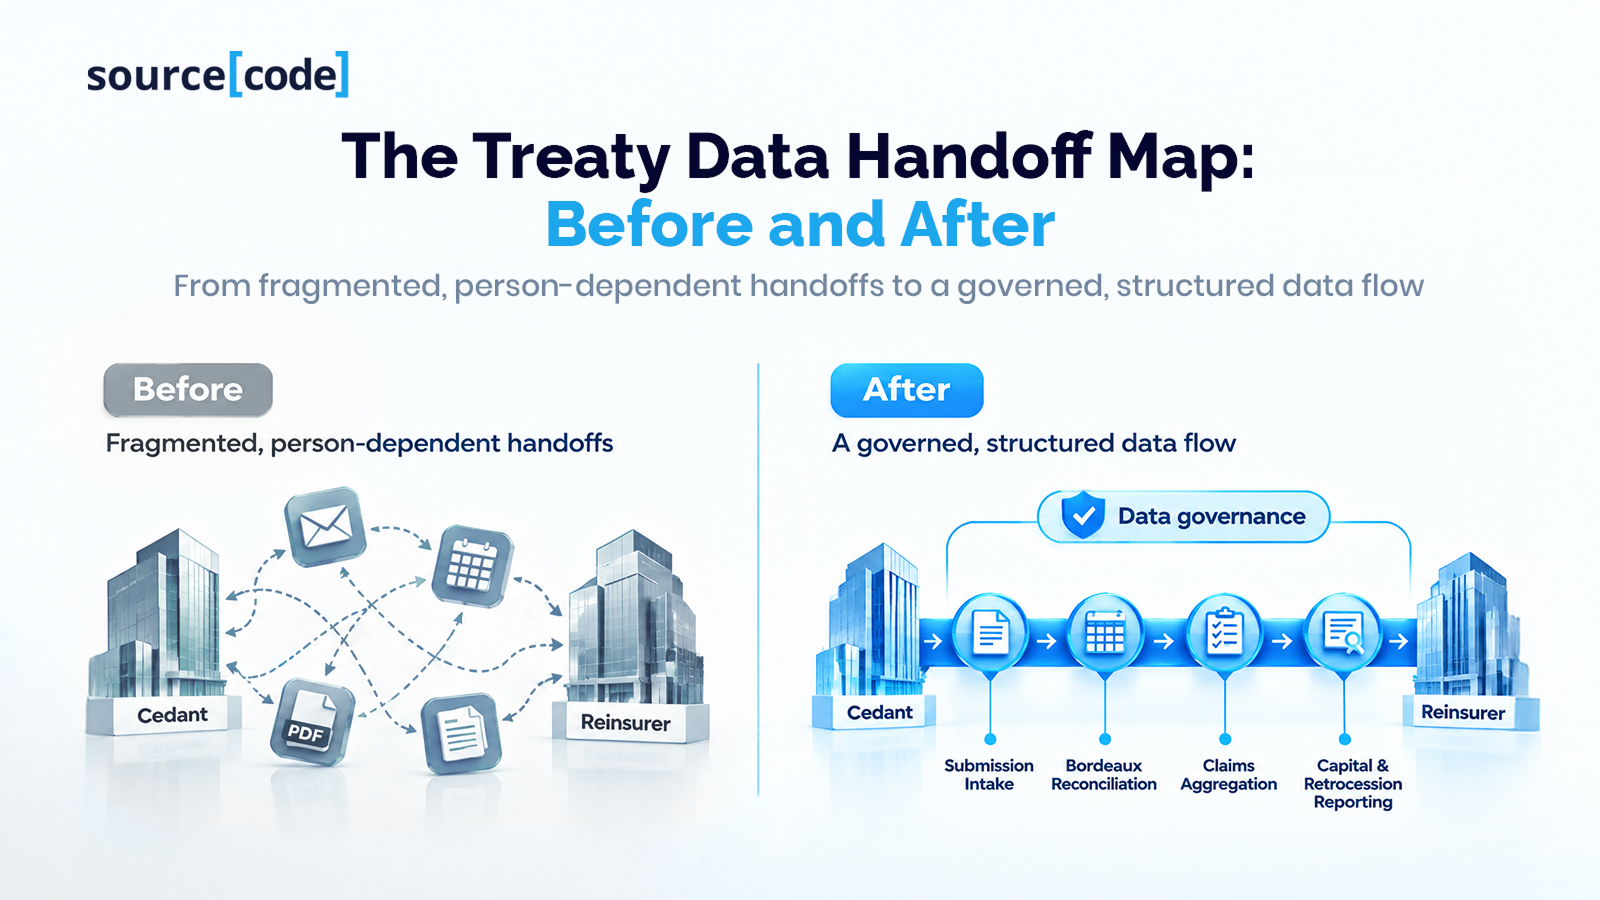
A Treaty Data Handoff Map typically surfaces four recurring failure points:
- Submission intake - risk data arriving as unstructured PDFs or spreadsheets with inconsistent field definitions across cedants, forcing reinsurer underwriters to manually re-key or reinterpret exposure data before it can be priced.
- Bordereaux reconciliation - premium and claims bordereaux arriving in cedant-specific templates, requiring bespoke mapping logic per relationship, with no shared standard for how mid-term adjustments, endorsements or return premiums are flagged.
- Claims notification and aggregation - individual claims for high-frequency perils (wildfire, convective storm, flood) reported claim-by-claim rather than through an aggregated, structured feed, which is manageable at low event frequency but breaks down as attritional losses rise.
- Capital and retrocession reporting - exposure and loss data that must be reformatted again for catastrophe bonds, sidecars, or structured capital providers, each of which may require different granularity or timing than the underlying treaty.
Mapped against an actual portfolio, these four points show finance and underwriting leaders exactly where their organisation's effective capacity to use reinsurance is being throttled - independent of how much capital is theoretically on offer in the market.
What Most Insurers and Reinsurers Get Wrong
The common error is to treat this as a technology procurement decision - "buy a bordereaux automation tool" or "stand up an AI layer on top of existing submissions" - without first mapping where in the handoff the actual breakage occurs. Capgemini's finding that most AI pilots in insurance "stay pilots" is instructive here: deploying a tool on top of an unmapped, inconsistent data flow tends to automate the inconsistency rather than remove it (Capgemini, via Reinsurance News, 2026).
A second, more defensible position deserves equal airtime: not every treaty type needs the same level of data standardisation urgency, and the economics of modernisation are not uniform across the market. Large, well-capitalised cedants placing complex structured or cat bond capacity have both the submission volume and the balance sheet to justify investment in standardised, API-driven data exchange. Smaller cedants, or those placing simpler proportional treaties with stable, long-standing reinsurer relationships, may find that the cost and complexity of a full data modernisation programme outweighs the benefit, at least in the near term - particularly where loss frequency in their specific book remains low. The Treaty Data Handoff Map is valuable precisely because it lets an organisation make this trade-off deliberately, treaty by treaty and relationship by relationship, rather than assuming either "do nothing" or "replatform everything" is the right default.
Business Implications for CFOs and Underwriting/Finance Leaders
For a CFO, the handoff problem shows up in three places that matter to the balance sheet and the income statement, not just operations:
- Capital efficiency. If bordereaux reconciliation and claims aggregation lag behind actual loss development, reported loss ratios and reserve positions lag reality - a problem that compounds when more of the book is attritional, high-frequency secondary-peril risk rather than infrequent, well-documented major catastrophe loss.
- Speed to capacity. In a softening market with ample capital, the organisations that can submit clean, well-structured data fastest are positioned to secure better terms and access structured or alternative capital (cat bonds, sidecars, structured covers) ahead of competitors still reconciling spreadsheets.
- Audit and regulatory exposure. Inconsistent bordereaux handling - particularly around endorsements, cancellations and return premiums - creates reconciliation gaps that surface at audit, renewal, or regulatory review, typically at the least convenient moment.
Technology and Data Implications
None of the four failure points identified by a Treaty Data Handoff Map require exotic technology to address. They require, in order: agreed data standards for submission intake; governed, versioned mapping logic for bordereaux (rather than ad hoc, person-dependent mapping); structured claims feeds capable of handling attritional volume rather than one-off notifications; and a single exposure and loss data layer that can be reformatted for different capital providers without re-keying from source documents each time. AI and automation genuinely help at each of these points - but, consistent with Capgemini's framing, only once the underlying workflow and data model have been redesigned, not simply digitised (Capgemini, via Reinsurance News, 2026).
What Leaders Should Do Next
- Map the actual data handoff across your top reinsurance relationships before evaluating any tool - treaty type by treaty type, not as a single enterprise-wide initiative.
- Prioritise the relationships and perils where loss frequency is rising fastest (secondary perils, attritional losses under the USD 2 billion band) - this is where manual handoffs are most exposed.
- Separate "standardise now" from "standardise later" decisions deliberately, using the cost/complexity trade-off as the deciding factor for smaller or lower-frequency books.
- Treat bordereaux and claims data governance as a finance and actuarial accountability, not solely an IT or operations task.
The sourceCode’s Perspective
From sourceCode's perspective, the most useful diagnostic we run with BFSI clients in this position is not a technology audit - it is the data handoff map itself: tracing, relationship by relationship, exactly where submission, bordereaux and claims data changes format, changes hands, or loses structure. In our experience working with BFSI environments across the Gulf and APAC, the organisations that get the most value from AI and automation investment are the ones that do this mapping exercise first and invest second, rather than the reverse.
That sequencing - understand the handoff before you try to fix it - is consistent with what the market data above is actually saying: the constraint in 2026 is not reinsurance capacity, it is the operational throughput standing between that capacity and the risk it is meant to cover.
Contact us here for further discussion!
Conclusion
The headline numbers for 2026 point in a reassuring direction for reinsurance buyers: capital is abundant, markets are softening, and new capacity instruments are proliferating. The quieter number - losses below USD 2 billion running 30% above their 10-year average, inside a year where secondary perils made up a record 92% of insured catastrophe losses - tells a different story about operational readiness. Treaty and facultative data that still moves by email and spreadsheet was a tolerable inefficiency when losses were infrequent and large. It is a capacity constraint when losses are frequent, varied, and have to be reconciled against an increasingly diverse set of capital providers. For CFOs and underwriting and finance leaders across Gulf and APAC insurers, closing that gap is no longer a back-office improvement project. It is a precondition for actually using the capacity the market is offering.
If this maps to a conversation your underwriting and finance teams are already having, a Treaty Data Handoff diagnostic is a useful starting point for seeing exactly where your own data breaks down between submission and settlement - worth exploring before the next renewal cycle, not after.
Frequently Asked Questions
What is the "reinsurance technology gap"? It refers to the gap between the sophistication of modern reinsurance capital instruments (treaty, cat bonds, structured covers) and the largely manual, email- and spreadsheet-based processes still used to exchange submission, bordereaux and claims data between cedants and reinsurers.
Why does reinsurance still rely on spreadsheets and email for data exchange? Primarily because bordereaux and submissions arrive in cedant-specific or broker-specific formats with no universal industry standard, making automated exchange difficult without bespoke mapping work for each relationship (Charles Taylor, n.d.).
Is reinsurance capacity actually scarce right now? No. Global dedicated reinsurance capital was tracking toward approximately USD 650 billion by year-end 2025, the highest since 2018, and the APAC market moved into a buyers' market with rate cuts through late 2025 (Guy Carpenter, 2025). The constraint discussed in this article is operational throughput, not capital availability.
What is a Treaty Data Handoff Map? It is a decision framework that traces every point where treaty, facultative, bordereaux or claims data changes hands or format between a cedant and a reinsurer, used to identify exactly where data quality or speed breaks down.
Do all reinsurance treaty types have the same data standardisation problem? No. Complex structured, cat bond and quota share arrangements with high submission volume tend to have the most acute standardisation needs; simpler proportional treaties with low-frequency books may not justify the same investment, which is a genuine cost/complexity trade-off smaller cedants should weigh deliberately.
How does this affect a CFO specifically, rather than just underwriting operations? Delayed or inconsistent bordereaux and claims data affects the accuracy and timeliness of loss ratio and reserve reporting, slows access to better-priced capacity and alternative capital, and increases audit and regulatory reconciliation risk.
Where should an insurer start if it wants to address this? By mapping the actual data handoff for its highest-volume or fastest-growing reinsurance relationships first, rather than beginning with a broad technology procurement exercise.
Reference List
Capgemini, cited in Reinsurance News (2026) Redesigning how humans and tech collaborate will separate leaders from laggards in 2026: Capgemini. Available at: https://www.reinsurancene.ws/redesigning-how-humans-and-tech-collaborate-will-separate-leaders-from-laggards-in-2026-capgemini/ (Accessed: 2 November 2026).
Charles Taylor (n.d.) How to capture data from bordereaux successfully. Available at: https://www.charlestaylor.com/en/news/news-post/how-to-capture-data-from-bordereaux-successfully (Accessed: 2 November 2026).
Guy Carpenter (2025) Discovering new growth opportunities: Asia Pacific, a well-capitalised market. Available at: https://www.guycarp.com/insights/2025/11/discovering-new-growth-opportunities-asia-pacific-well-capitalised-market.html (Accessed: 2 November 2026).
Reinsurance News (2026) Secondary perils account for 92% of global insured losses in 2025: Swiss Re. Available at: https://www.reinsurancene.ws/secondary-perils-account-for-92-of-global-insured-losses-in-2025-swiss-re/ (Accessed: 2 November 2026).
Swiss Re Institute (2026) Wildfires, storms, floods contribute to record 92% of global insured losses in 2025, says Swiss Re Institute [Press release]. Available at: https://www.swissre.com/press-release/Wildfires-storms-floods-contribute-to-record-92-of-global-insured-losses-in-2025-says-Swiss-Re-Institute/7b39b1a5-b878-4a55-a5ff-bf5aa561a675 (Accessed: 2 November 2026).