Key Takeaways
- KPMG's 2025 Insurance CEO Outlook found 67% of insurance CEOs now expect returns from AI investment within one to three years, up sharply from 21% in 2024 - a global, company-size-agnostic figure that most vendor payback pitches quietly borrow without adjustment (KPMG, cited in Capital FM Africa, 2026).
- WTW's 2026 Advanced Analytics and AI Survey, covering 59 US and Canadian P&C insurers - large, data-mature carriers by global standards - found 42% still cite data quality and accessibility as a significant barrier, and only 20% have a well-defined analytics strategy guiding daily work (WTW, 2026). If that is the barrier rate among resourced North American carriers, it is not a reasonable baseline for a mid-size APAC insurer's payback timeline.
- This publication's 10 September analysis, the Data Readiness Ledger, scores an insurer's AI-readiness across four dimensions - structure, currency, lineage and reach - and found industry-wide evidence that more than 90% of insurer data remains unstructured and insufficiently governed for an AI system to act on safely.
- A credible payback estimate should be built from an institution's own Data Readiness Ledger score, not from a vendor's reference customer or a global CEO survey's central tendency. The practical effect, for most mid-size APAC insurers starting from a weak-to-moderate Ledger score, is a payback curve measured in years, not the 12-to-18-month range common in vendor sales decks.
- This is not an argument against investing in AI - WTW's data shows analytics-sophisticated insurers carry six points better combined ratio and three points better premium growth than slower adopters. It is an argument for pricing the investment against your own starting position, not someone else's.
Introduction
A mid-size APAC insurer's board is, by now, almost certainly looking at the same slide every other insurer's board has seen: AI investment delivering returns within one to three years, cited from a survey, attributed to "the industry." KPMG's own 2025 Insurance CEO Outlook is probably the source of that exact figure - 67% of insurance CEOs now expect AI returns inside that window, up from just 21% a year earlier (KPMG, cited in Capital FM Africa, 2026). It is a real finding, from a credible survey. It is also a global, company-size-agnostic number, and treating it as a planning assumption for a specific mid-size carrier in Southeast Asia, Hong Kong or the Gulf is a different exercise from reporting what CEOs, in aggregate, expect.
The gap between an aggregate expectation and a specific institution's realistic payback curve is not a rounding error. It is the difference between a board approving an investment on a false premise and a CFO building a credible, defensible model grounded in the institution's own starting position. This piece sets out why that gap exists, what the evidence says about where it is widest, and how to build a payback estimate that survives scrutiny rather than simply repeating the number from the last vendor deck.
What the optimistic numbers are actually measuring
KPMG's finding is worth taking at face value for what it is: insurance CEOs, as a group, have become substantially more confident about AI's return timeline in a single year. The same survey found 73% of insurance CEOs now rank AI adoption as their top investment priority, and 67% plan to commit 10-20% of their budgets to it (KPMG, cited in Capital FM Africa, 2026). That confidence is not evenly distributed, and the survey itself offers a clue about why: apart from a small number of mutuals, the report notes that companies are under pressure to show fast payback specifically to meet investors' short-term expectations. A sentiment survey of CEOs under commercial pressure to project confidence is a useful signal of industry mood. It is not a substitute for a bottom-up estimate of what a specific carrier's own data and systems can actually support.
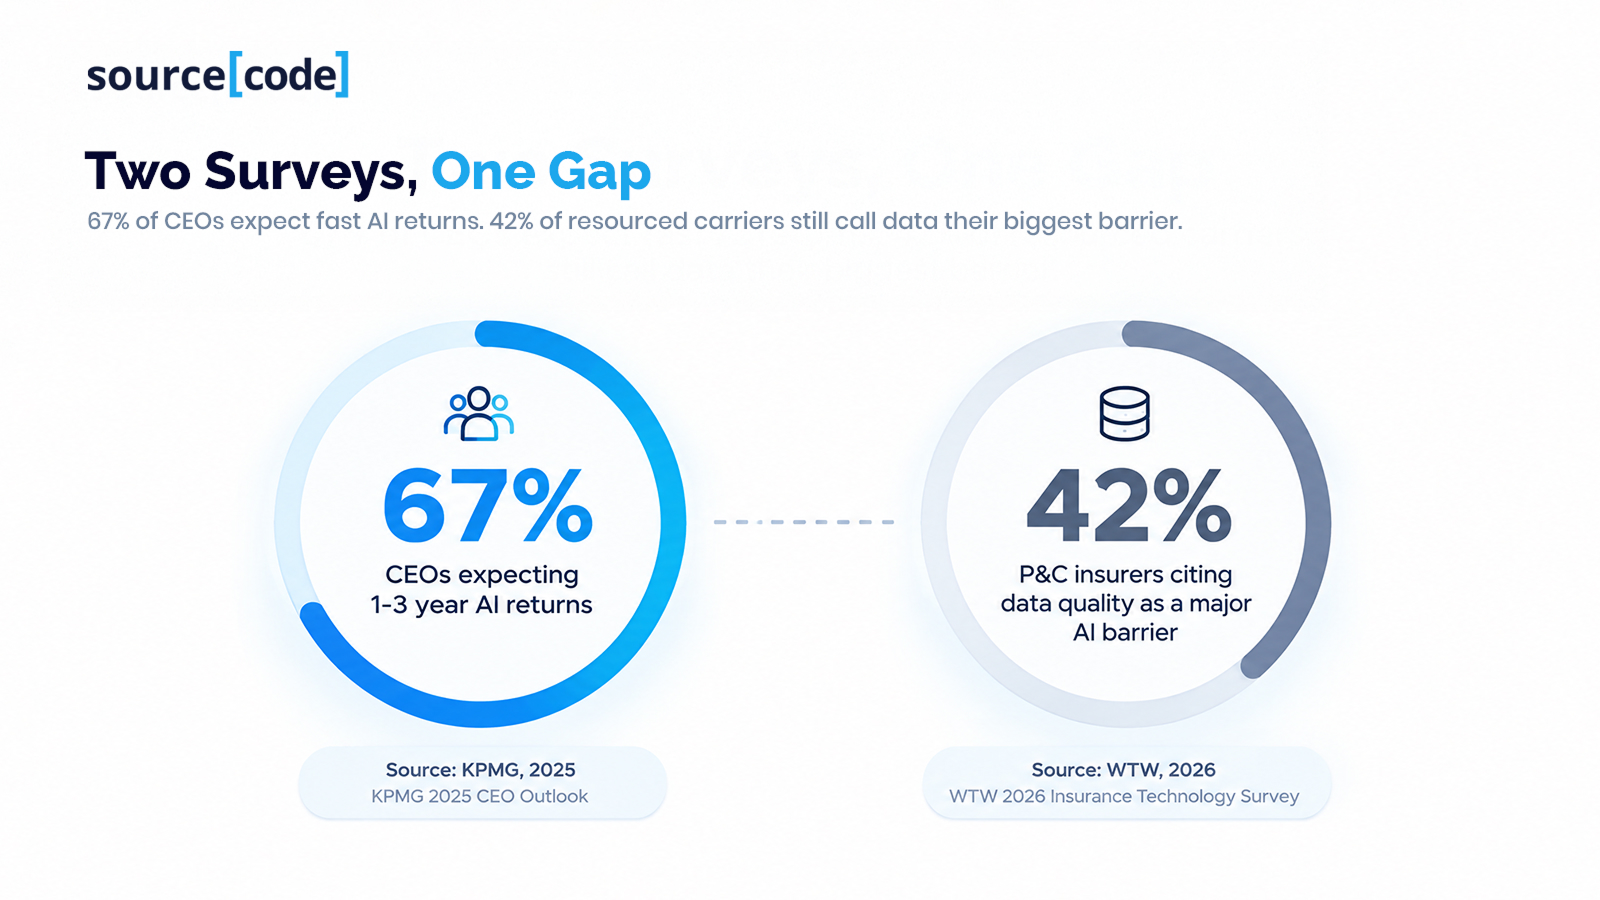
A second, independent data point sharpens the picture further. WTW's 2026 Advanced Analytics and AI Survey - covering 59 property and casualty insurers across the United States and Canada, markets with generally more mature data infrastructure and larger technology budgets than most mid-size APAC carriers - found that 42% of respondents still cite data quality and accessibility, along with inadequate IT support, as significant barriers to their AI and analytics programmes. Only 20% report having a well-defined analytics strategy that actually guides daily work, and only 33% currently use fraud-detection analytics in claims, with the survey's own respondents expecting that to reach just 65-70% within two years (WTW, 2026). These are large, resourced, English-speaking-market carriers reporting substantial data and strategy gaps. If that is the realistic state of AI readiness among a cohort with every structural advantage over a mid-size APAC insurer, a payback estimate for the latter needs to start from a considerably more conservative baseline than either survey's headline optimism implies.
The data-readiness link this publication has already established
This publication's 10 September analysis, "The Underwriting Data Problem Agentic AI Can't Fix," made the underlying mechanism explicit for insurance specifically: industry research puts the unstructured share of enterprise data inside insurers above 90%, and found that AI tools reach durable production use roughly twice as often when the underlying data has been properly structured, kept current and traceably sourced than when it hasn't. That piece introduced the Data Readiness Ledger - a four-dimension score across structure, currency, lineage and reach - as the diagnostic a Chief Underwriting Officer and CTO should run jointly before committing budget to an agentic AI build.
The direct implication for a payback-period estimate is this: the Data Readiness Ledger is not only a readiness gate for whether to proceed with an AI initiative. It is the single best predictor available of how long that initiative will actually take to pay back, because nearly every documented cause of AI deployment delay - rework from poor extraction confidence, manual reconciliation of stale or unverified data, and the human-review overhead needed to compensate for weak lineage - shows up directly as cost and elapsed time between go-live and measurable return. A carrier scoring strongly across all four Ledger dimensions is approaching the conditions under which a 12-to-18-month payback, of the kind common in vendor sales material, becomes plausible. A carrier scoring weakly on two or more dimensions is not in the same reference class at all, and pricing its business case against the same timeline is the planning error this article is addressing.
Building a realistic payback curve
Rather than adopting a single vendor-quoted number, a mid-size APAC insurer's CFO should build a payback estimate in three steps. First, score the specific line of business the AI initiative targets against the Data Readiness Ledger's four dimensions, honestly and specifically - not as an organisation-wide average, since structure and lineage quality frequently differ sharply between, say, a mature motor book and a newer or more document-heavy commercial line. Second, treat each weak dimension as an explicit addition to the payback timeline rather than a general caveat: a structure gap adds extraction-build and validation time before the system can be trusted on live decisions; a currency gap adds the time needed to establish a refresh cadence the AI can rely on; a lineage gap adds the human-verification overhead that remains necessary until provenance can be trusted; a reach gap adds the integration work needed before the AI's output actually displaces, rather than duplicates, existing underwriter or claims-handler effort. Third, benchmark the resulting estimate against the vendor's own reference customers using the reference-evaluation discipline this publication set out on 26 October - specifically asking whether those reference customers' own Ledger scores resemble the buyer's, not simply whether they are satisfied with the outcome.
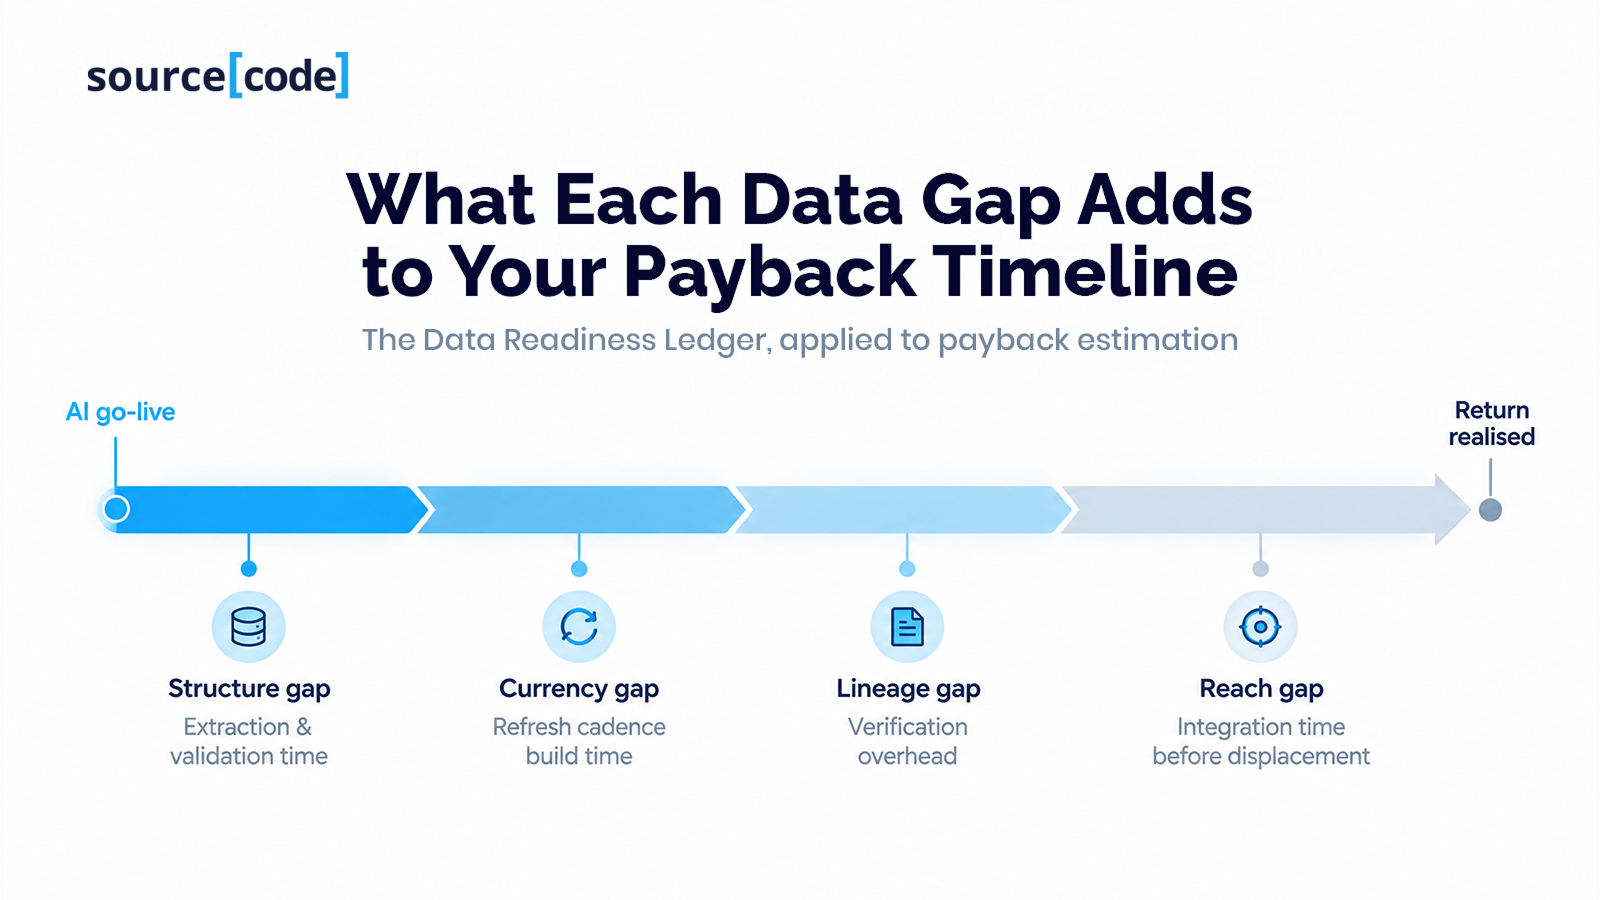
The result is a payback curve, not a single number: an insurer strong on all four Ledger dimensions might reasonably target the 12-to-18-month range vendor materials typically quote; an insurer weak on two or more dimensions should expect a materially longer curve, and should say so explicitly in the business case rather than quietly adopting the vendor's number and hoping the gap closes itself during implementation.
A fair counterargument
The WTW data itself provides the honest counterpoint to an overly cautious reading of this argument: insurers using more sophisticated analytics recorded combined ratios six percentage points better, and premium growth three points higher, than slower adopters between 2022 and 2024 (WTW, 2026). The lesson here is not that AI investment doesn't pay off, or that mid-size APAC insurers should wait for perfect data before acting - waiting indefinitely for ideal data readiness is its own, well-documented failure mode, and the institutions that benefited most in WTW's data were earlier movers, not later ones. The argument is narrower: the size of the payoff and the time it takes to arrive are both functions of starting data readiness, and a CFO who prices the investment against a vendor's best-case timeline, rather than the institution's own Ledger score, is the one most likely to be blindsided by a slower-than-promised return - and to lose internal credibility for the next AI proposal as a result.
Business and technology implications
For a CFO, this means the business case for an AI initiative should include the underlying Ledger score as a stated input, with the payback estimate explicitly conditioned on it - making the assumption auditable rather than implicit. For a Chief Underwriting Officer or Head of Claims sponsoring the initiative, it means being honest, in the same business case, about which specific data gaps the Ledger surfaces, rather than letting the technology team's optimism about model capability stand in for an honest assessment of the data it will actually run on. For a CTO, it means the remediation work implied by a weak Ledger score - structure, currency, lineage, reach - should appear as a budgeted, time-boxed phase of the same programme, not as an unstated assumption baked silently into an aggressive payback estimate.
What leaders should do next
Score the specific line of business behind your next AI business case against the four Data Readiness Ledger dimensions before accepting a vendor's payback estimate, and treat any gap identified as an explicit addition to the timeline rather than a footnote. Ask the vendor's reference customers, specifically, how their own data readiness compared to yours before the engagement began - not just whether they are satisfied with the result now. And present the resulting payback curve to your board as a range conditioned on your own starting position, rather than as the single confident figure from the last industry survey.
The sourceCode’s perspective
In our delivery work with insurers across APAC and the Gulf, the AI business cases that hold up under board scrutiny eighteen months later are the ones that were honest, at the proposal stage, about where the institution actually stood on data readiness - and that priced the payback timeline accordingly, even when that meant presenting a longer curve than a competing vendor's pitch. The business cases that get revisited awkwardly a year in are usually the ones that borrowed an industry-average payback figure because it made for a cleaner slide.
A realistic payback estimate, grounded in your own Data Readiness Ledger score, is a harder number to present to a board than "returns within one to three years, per KPMG." It is also the one that will still be true in eighteen months. Connect us here for further discussion!
Conclusion
Industry surveys report what institutions, in aggregate, expect or hope. A credible payback estimate for a specific mid-size APAC insurer has to be built from that institution's own starting position, not from a global CEO sentiment figure or a reference customer whose data estate may look nothing like its own.
The evidence this publication has gathered across two pieces now - the data-readiness gap documented on 10 September and the AI-maturity gaps WTW found even among resourced North American carriers - points the same way: a realistic payback curve is a function of your own Data Readiness Ledger score, and building the business case around anything else is building it around someone else's starting position.
Frequently Asked Questions
What payback period do insurance CEOs expect from AI investment? KPMG's 2025 Insurance CEO Outlook found 67% of insurance CEOs expect returns from AI investment within one to three years, up from 21% the prior year. This is a global, aggregate figure across companies of varying size and data maturity, not a benchmark calibrated to any specific institution.
Why might a mid-size APAC insurer's realistic AI payback period be longer than vendor estimates suggest? Because vendor payback claims and industry survey averages are typically drawn from, or benchmarked against, larger and more data-mature carriers. WTW's 2026 survey found 42% of resourced US and Canadian P&C insurers still cite data quality as a significant AI barrier; a mid-size APAC insurer starting from a weaker data-readiness position, as documented in this publication's 10 September analysis, should expect a correspondingly longer curve.
What is the Data Readiness Ledger, and how does it relate to AI payback timing? It is a four-dimension diagnostic - structure, currency, lineage and reach - introduced in this publication's 10 September 2026 piece on agentic AI in underwriting. Each dimension an insurer scores weakly on adds a specific, identifiable delay to the time between an AI initiative's go-live and its measurable return.
Does this mean mid-size APAC insurers should delay AI investment until their data is perfect? No. WTW's data shows insurers using more sophisticated analytics already outperform slower adopters on combined ratio and premium growth. The recommendation is to invest with an honest, Ledger-informed payback estimate, not to wait indefinitely for ideal data conditions.
How should a CFO evaluate a vendor's payback period claim? Ask whether the vendor's reference customers' own data-readiness position, at the time of their engagement, resembled the buyer's - not simply whether those references are satisfied with the outcome - and build the payback estimate from the buyer's own Data Readiness Ledger score rather than adopting the vendor's quoted figure directly.
Reference List
KPMG (2025) Insurance CEO Outlook 2025, cited in Capital FM Africa (2026) 'Insurers to ramp up AI investment as CEOs target faster returns - KPMG', 23 January. Available at: https://capitalfm.africa/insurers-to-ramp-up-ai-investment-as-ceos-target-faster-returns-kpmg/ (Accessed: 28 October 2026).
Willis Towers Watson (2026) 2026 Advanced Analytics and AI Survey. 19 March. Available at: https://www.wtwco.com/en-ca/news/2026/03/insurers-using-advanced-analytics-and-ai-report-strong-returns-on-investment-and-premium-growth (Accessed: 28 October 2026).
sourceCode (2026) The Underwriting Data Problem Agentic AI Can't Fix. 10 September. https://www.sourcecode.com.au/blog/underwriting-data-problem-agentic-ai (Accessed: 28 October 2026).
sourceCode (2026) Why Reference Customers Aren't Enough Anymore for BFSI AI Vendor Selection. 26 October. https://sourcecode.com.au/blog-bfsi-ai-vendor-reference-check-evaluation (Accessed: 28 October 2026).